In-Vehicle Coupon Recommendation
Executive Summary
From 2537 survey scenario responses, our random forest estimated an overall food and dining merchant-advertiser 199% return on ad spend (ROAS) uplift at a 91% coupon acceptance rate and 28% of coupon acceptances captured.
1. The Problem
Food and dining merchant-advertisers need to cost effectively increase reach to consumers and drive sales to their venue via coupon recommendations.
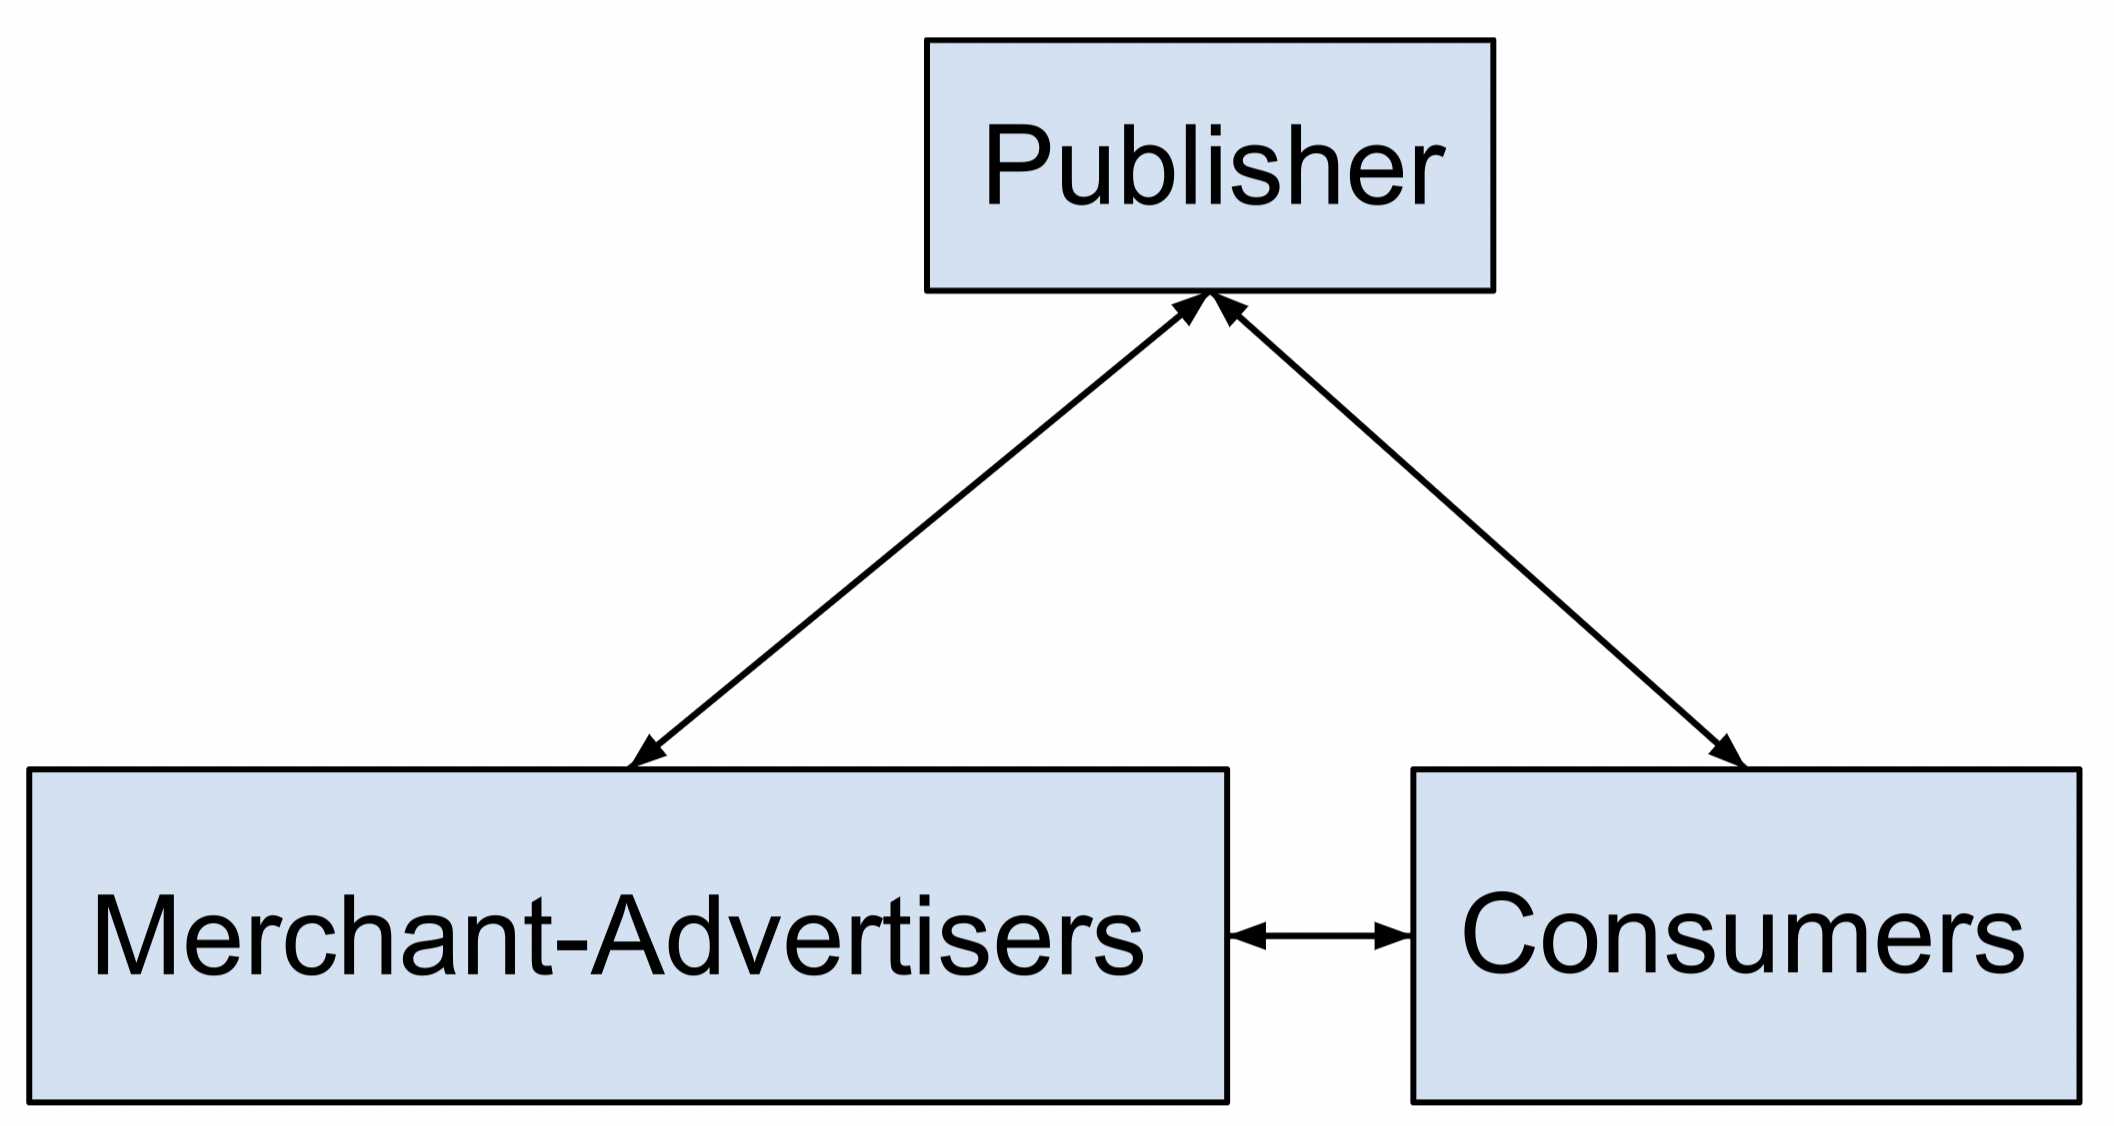
The merchant-advertiser is food & dining businesses, e.g., takeouts, coffee houses, bars, low-cost restaurants, and mid-range restaurants.
The consumer is USA vehicle drivers with a smartphone (estimated at 182 million individuals).
2. The Solution
We the publisher provide the platform for merchant-advertisers to efficiently reach in-vehicle drivers. Using ML models and some assumptions, we estimated the expected campaign coupon acceptance rate, percentage of coupon acceptances captured, and ROAS uplift.
3. The Data
Our data was the Amazon Mechanical Turk survey scenario responses dataset [1]. It’s made up of 654 survey participants and represents a sample of the population which we defined as drivers in the USA with a smartphone.
- In-Vehicle Coupon Recommendation Scenario Response Survey Dataset: UCI Machine Learning Repository
4. ML Model Comparison
In the figure below is the coupon acceptance rate vs. percentage of coupon acceptances captured plot for the random forest and gradient boosting in the 5-fold CV train set.
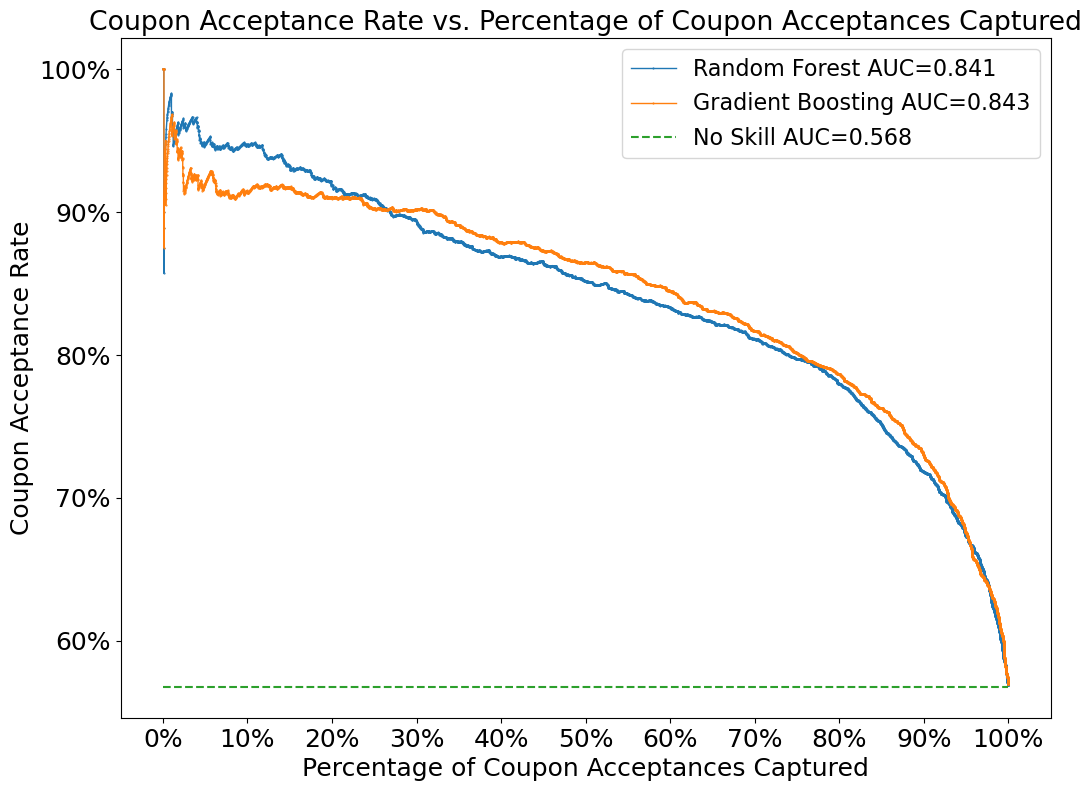
Here, the random forest performed better for higher coupon acceptance rate and the gradient boosting performed better for higher percentage of coupon acceptances captured.
5. Campaign Model Metrics
In running our pilot campaign model, we found the takeout, coffee house, and low-cost restaurant merchant-advertisers showed good coupon acceptance rate, percentage of coupon acceptances captured, and coupon acceptances. The bar and mid-range restaurant merchant-advertisers were with good coupon acceptance rate, but with lesser percentage of coupon acceptances captured and coupon acceptances.
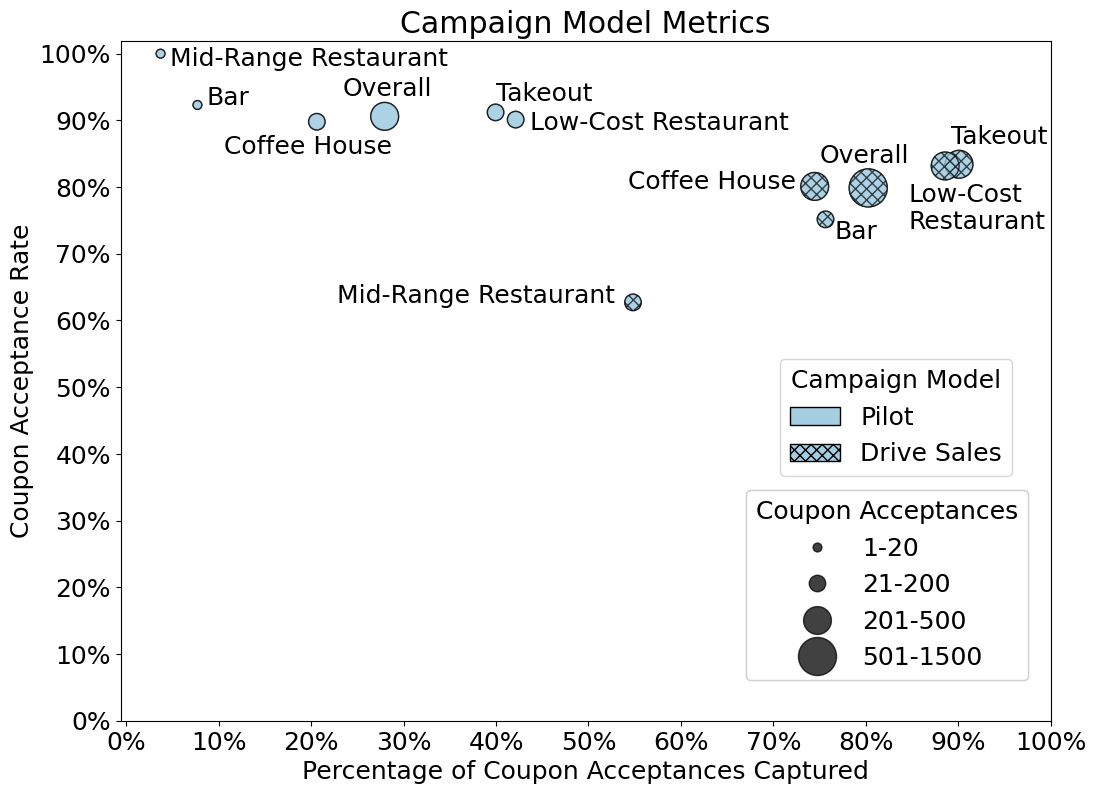
Making further assumptions of the merchant-advertiser by coupon average sale, targeted coupon recommendation cost, and non-targeted coupon recommendation cost, we measured ROAS and ROI.
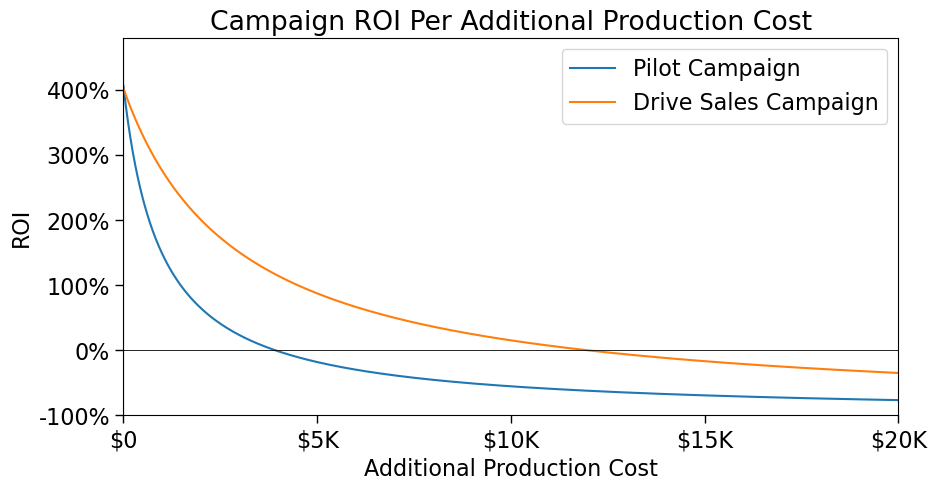
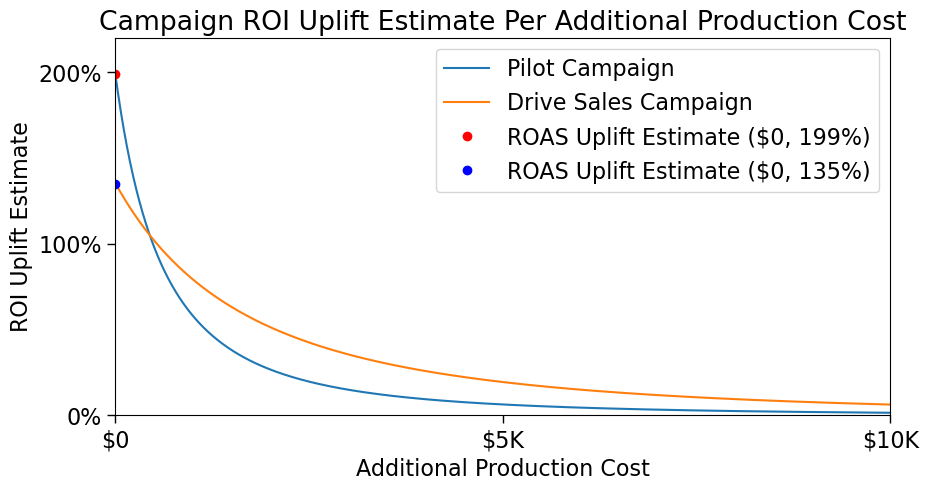
With increased additional production cost, the drive-sales campaign model ROI was more resistant to dropoff and had higher ROI per additional production cost.
Conversely, there was a clear benefit in the pilot campaign model over the drive-sales campaign model, namely, a higher ROAS uplift estimate at 199% instead of 135%, primarily due to higher coupon acceptance rate uplift. However, with increased additional production cost the pilot campaign model was less resistant to ROI uplift dropoff compared to the drive-sales campaign.
6. Conclusion
A pilot campaign model via random forest was applied to the 2537 scenario responses test set. The merchant-advertisers showing preferred coupon recommendation metrics were the takeout, coffee house, and low-cost restaurant because of good coupon acceptance rate, percentage of coupon acceptances captured, and coupon acceptances. The bar and mid-range restaurant merchant-advertisers were with good coupon acceptance rate, but with lesser percentage of coupon acceptances captured and coupon acceptances. A similar, but less pronounced trend was seen in the drive-sales campaign model. Overall, in the pilot campaign model, we estimated a 199% ROAS uplift at 91% coupon acceptance rate and 28% of coupon acceptances captured. For comparison, in our drive-sales campaign model, we estimated a 135% ROAS uplift at 79% coupon acceptance rate and 80% of coupon acceptances captured.
7. References
[1] A Bayesian Framework for Learning Rule Sets for Interpretable Classification, https://jmlr.org/papers/volume18/16-003/16-003.pdf
8. Appendix
Jupyter Notebook: In-Vehicle Coupon Recommendation
9. Acknowledgements
A special thanks to Blake at Springboard for his insight and guidance on this capstone. It would not have all been possible without you.

