
NBA Game Score Difference Prediction
Executive Summary
From a random forest and betting policy, we bet on sportsbook NBA game spreads to achieve a 45% ROI at 70% accuracy in the 2017-18 season.
Business Understanding
NBA sportsbook spread bettors want to bet on games and win; however, less than 6% have been profitable. We provided a hybrid model–with random forest and betting policy components–for individuals to profit in NBA sportsbook spread betting.
Data Understanding
NBA data of the game, team, and player level were collected. Also, sportsbook NBA spread data was collected for additional ML model evaluation. Data sources included Kaggle, nba_api, and Wikipedia.
Data Preparation
Our predicted variable was the score difference. As shown in Figure 1, the score difference distribution was bimodal. An NBA game was either won or lost such that no game resulted in a tie.

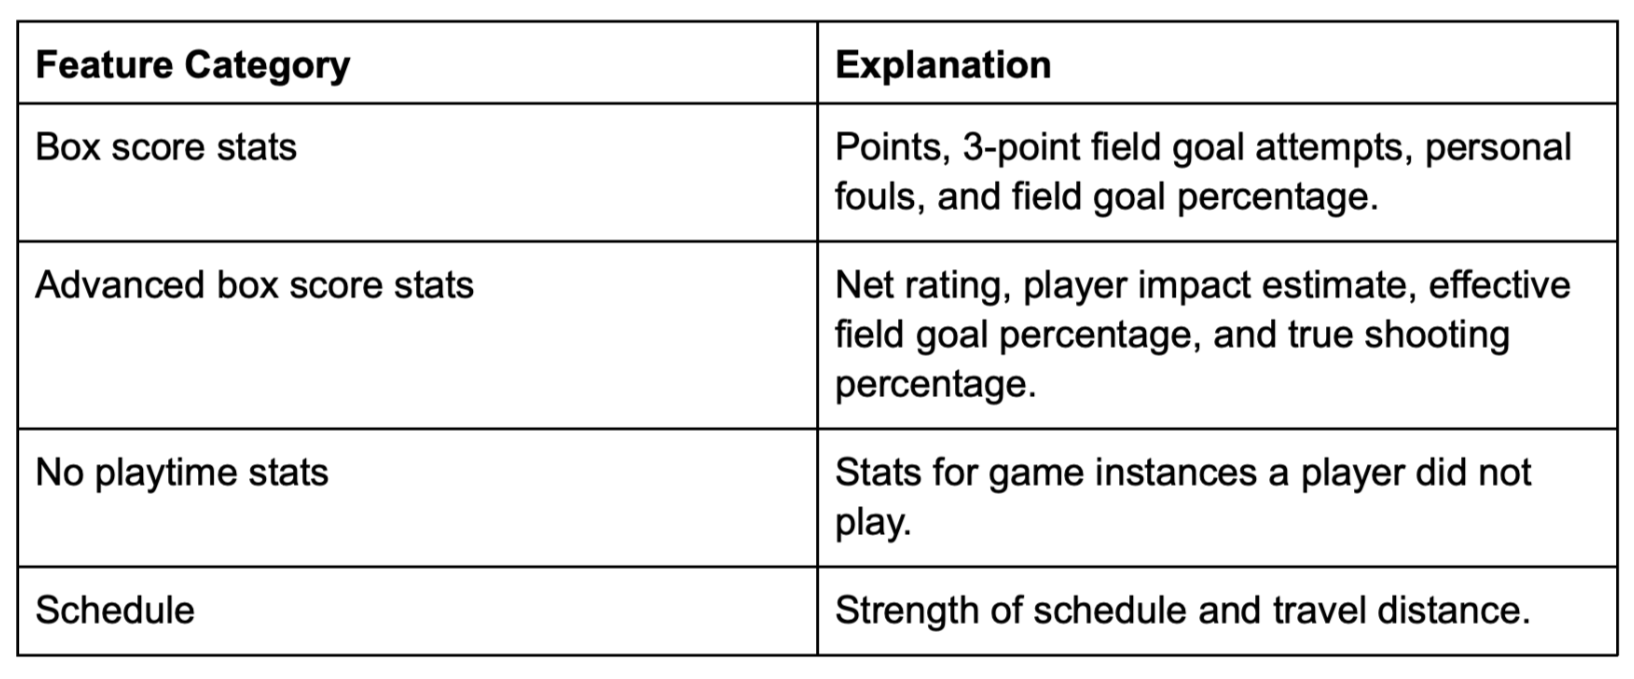
In feature engineering, we filtered our datasets for the 2009-10 through 2017-18 seasons, as well as cleaned data at both the team and player level. Team difference features were formed and binned to four major categories including box score stats, advanced box score stats, no playtime stats, and schedule, as shown in Table 1.
The simplest feature engineering was of the team box score stat and team advanced box score stat features. This process of calculating the season cumulative team stats for games previous to the current game is shown in Figure 2.

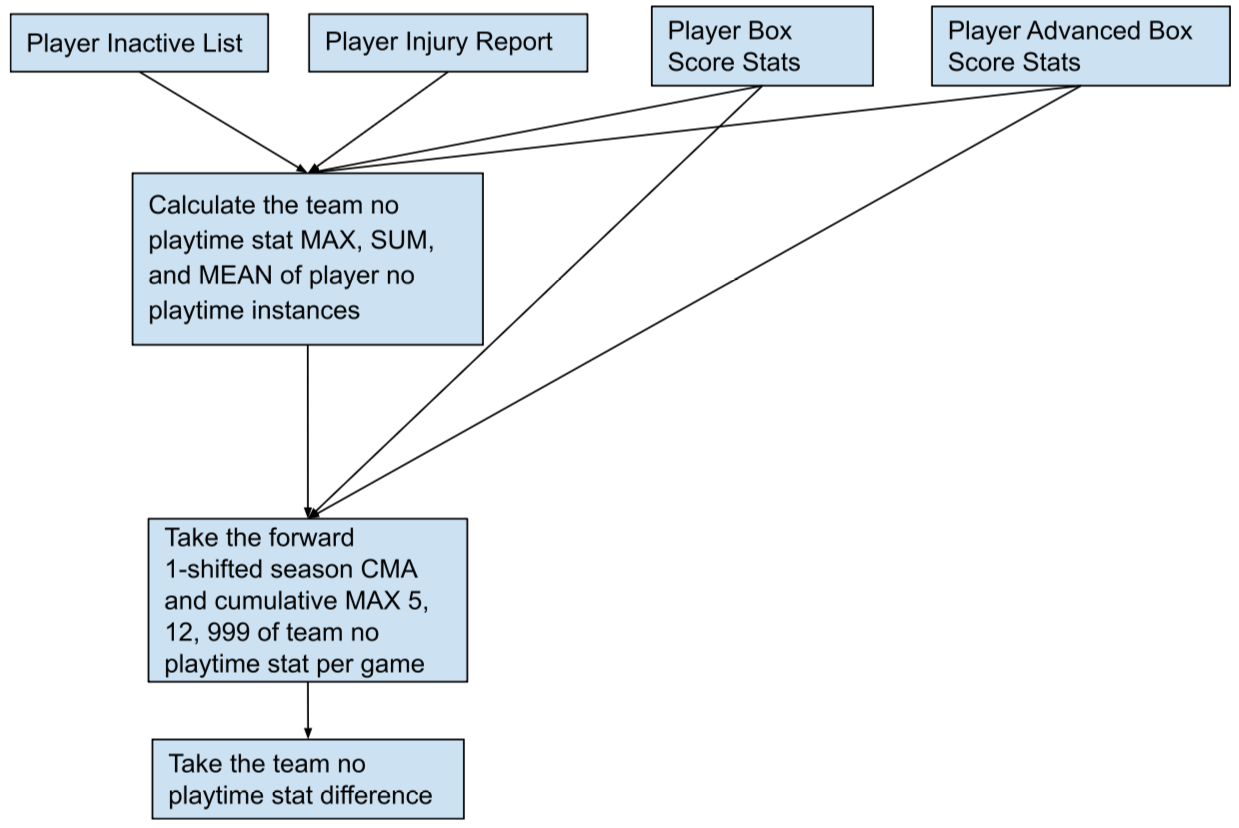
The no playtime feature category captured games players did not play. It included lost contributions due to player injury and can be viewed as a disruption in team chemistry [1]. Additional causes of player no playtime instances included player load management, benching by coach, and placement on the inactive list. The feature engineering process of the no playtime stats feature category is shown in Figure 3.
Modeling
Following the creation of features, we moved to data modeling and feature selection. We used MDI of the scikit-learn random forest library to determine our features of greatest importance. By running random forest models on smaller datasets and collecting the top features, we filtered out for less important features and just kept those with the most predictive power.
In addition, because some of our top features behaved very similarly and in some cases were just inverses of each other, these duplicate-like features were dropped as shown in Figure 4.
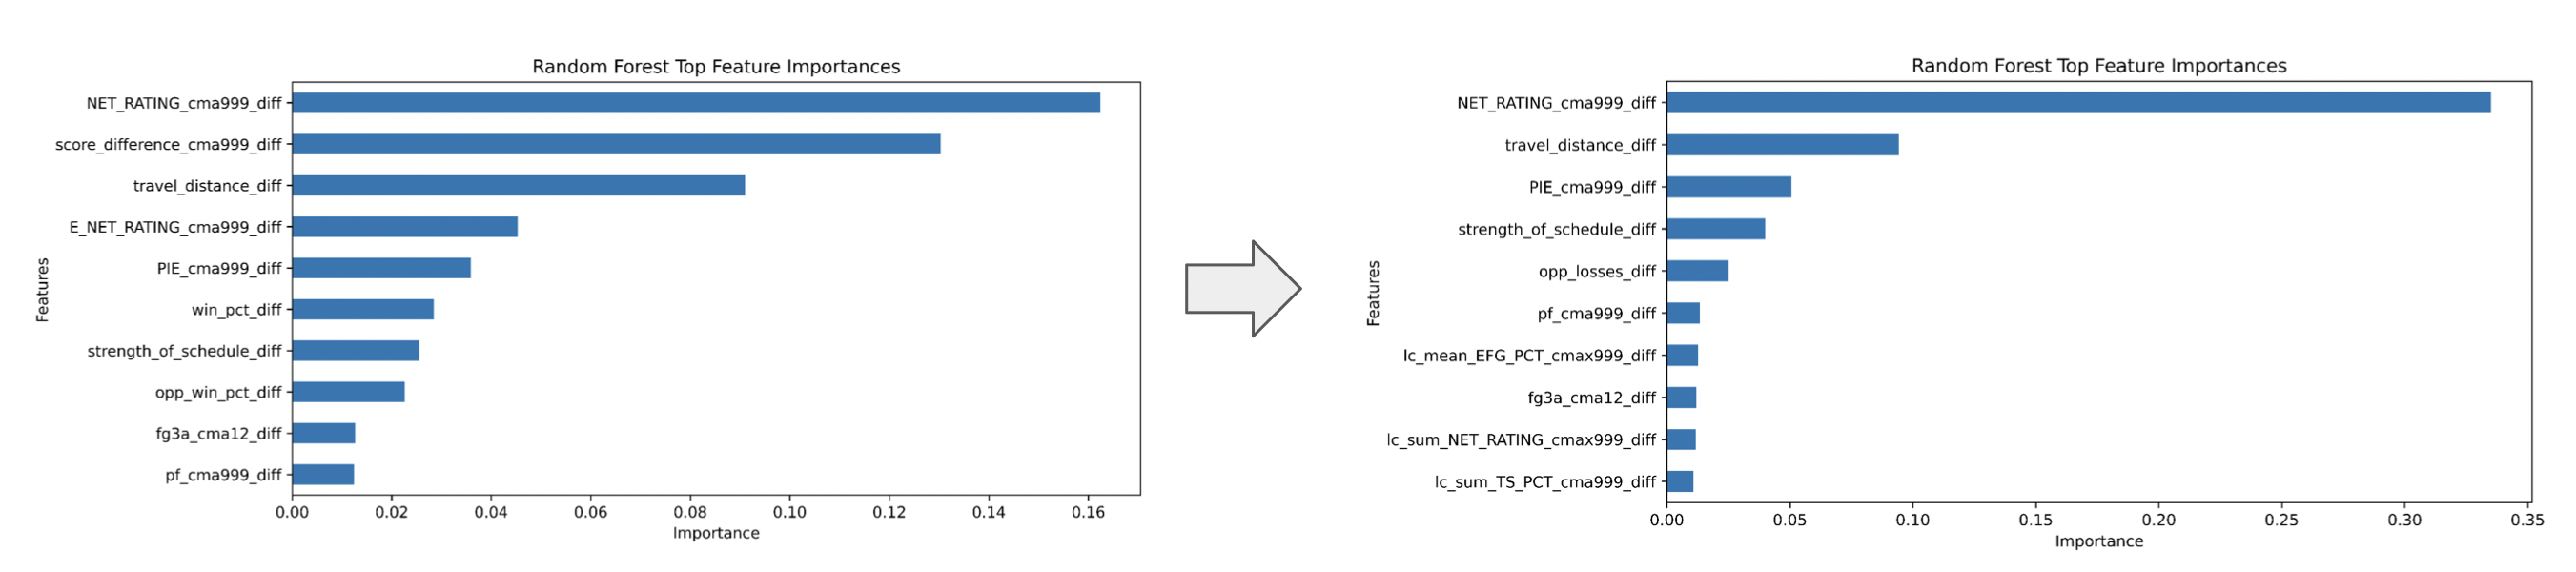
After high correlations were removed our top 100 features became our top 89.
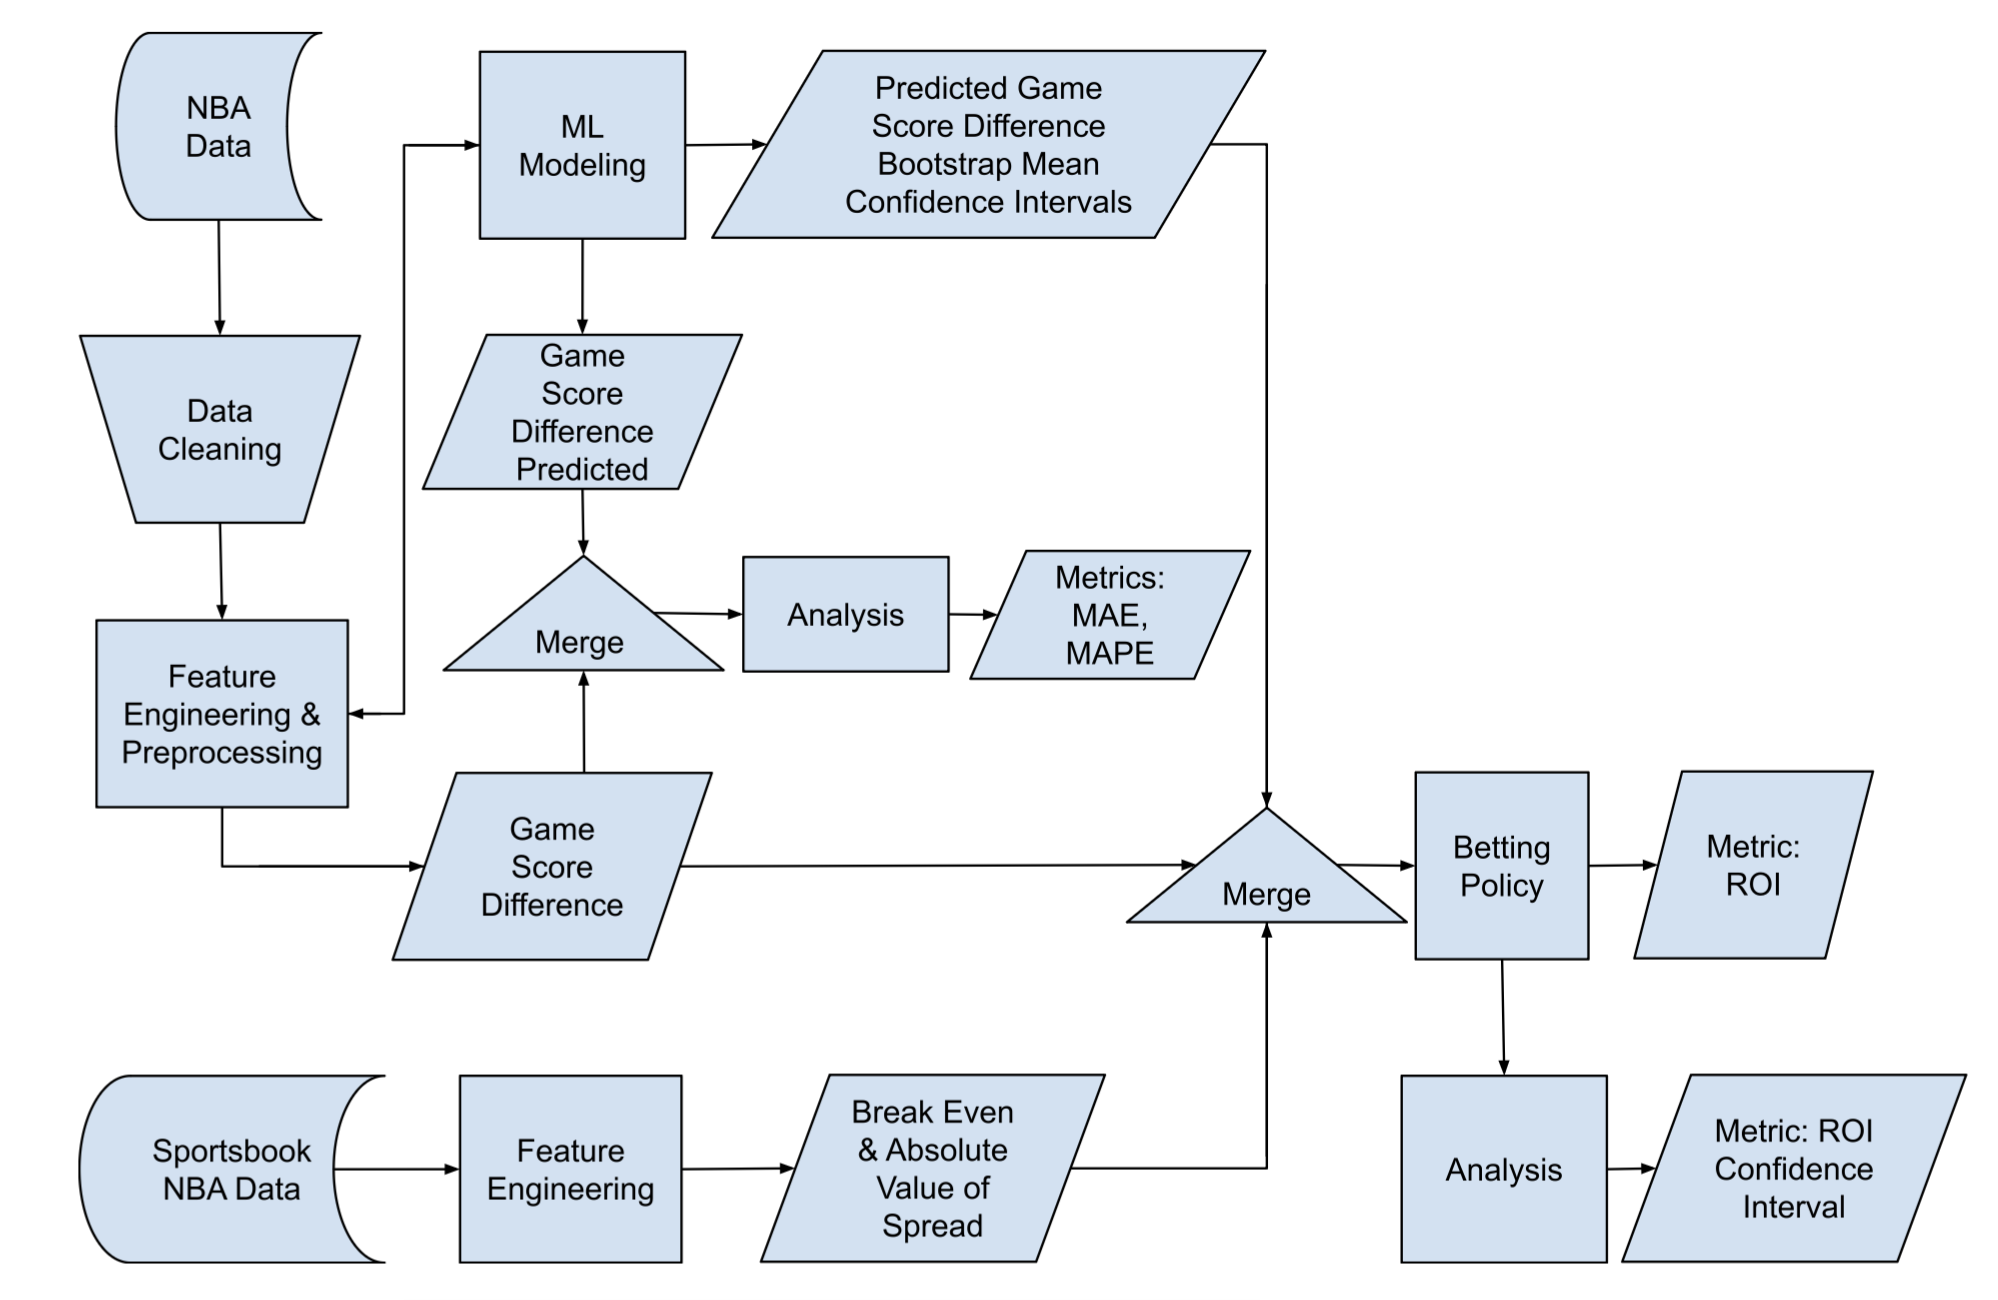
From our time series random forest game collection, we outputted game score difference prediction confidence intervals. From this, in conjunction with NBA sportsbook data, we formed filters for our learned betting policy, shown in Figure 5.
Evaluation
From our random forest and other ML models of the NBA 2017-18 season, we collected MAE and MAPE as shown in Table 2.
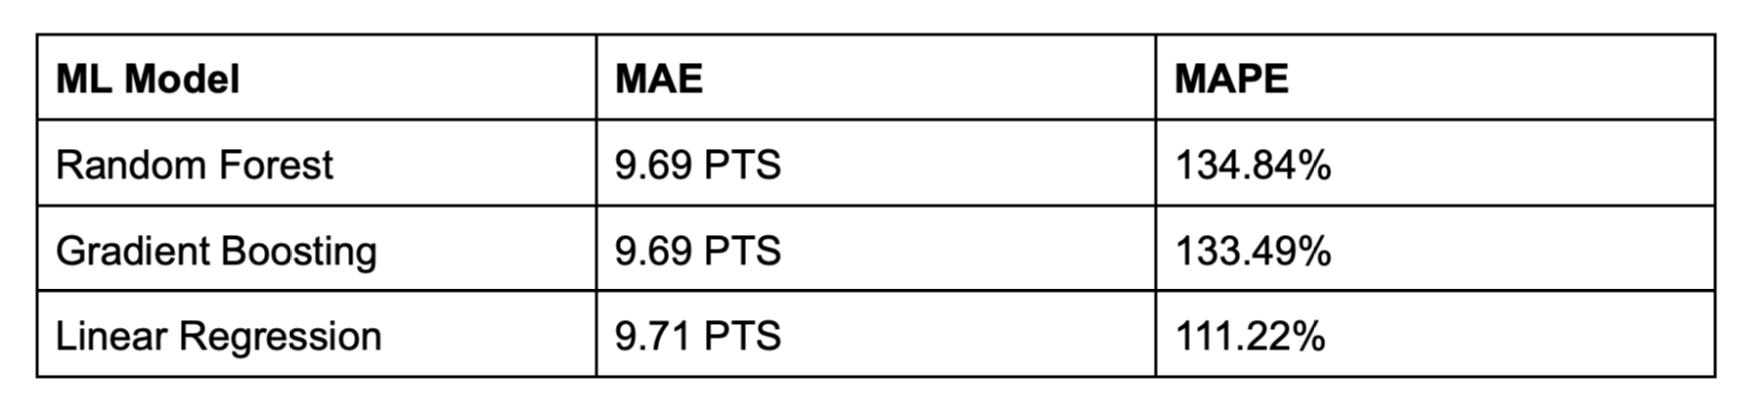
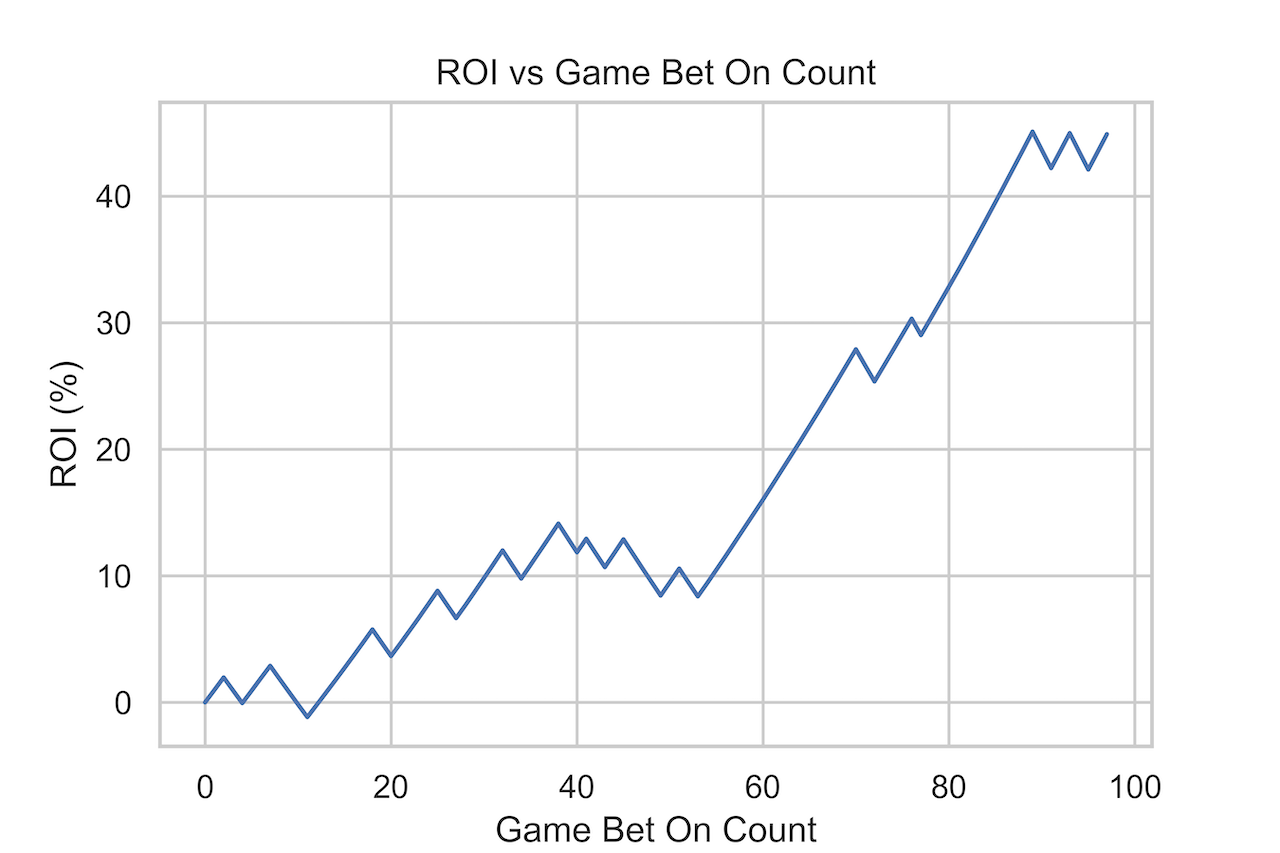 Figure 6. ROI Graph. Implementing a rule of thumb 1% of account balance per bet, we achieved a 45% ROI in the NBA 2017-18 season. Figure 6. ROI Graph. Implementing a rule of thumb 1% of account balance per bet, we achieved a 45% ROI in the NBA 2017-18 season. |
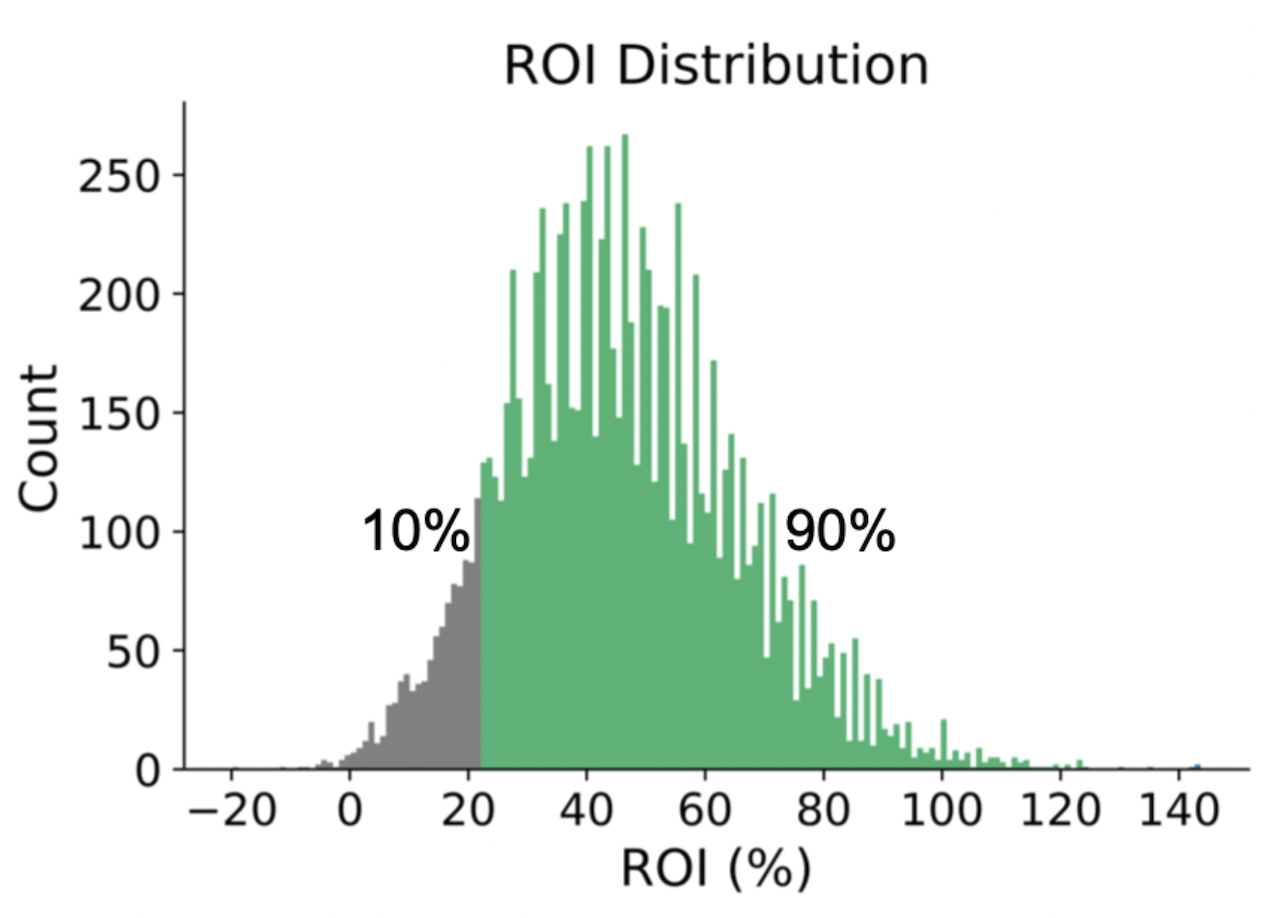 Figure 7. ROI Distribution. Betting on a bootstrapped sampling on this 2017-18 season sportsbook games dataset suggested 90% of the time, we expected a ≥22% ROI. Figure 7. ROI Distribution. Betting on a bootstrapped sampling on this 2017-18 season sportsbook games dataset suggested 90% of the time, we expected a ≥22% ROI. |
Conclusion
We formed a hybrid model using NBA game and sportsbook data and then tested it in the 2017-18 season. Our trained random forest was a good ML model for game score difference prediction and achieved a 9.7 PTS MAE. Taking our learned betting policy with a rule of thumb 1% of account balance per spread bet, we achieved a 45% ROI at 70% accuracy. Betting on a bootstrapped sampling on this 2017-18 season sportsbook games dataset suggested that 90% of the time, we expected a ≥22% ROI.
Future Work
To improve the ML model and therefore ROI, compiling more recent and categorically different data, such as quarter-by-quarter, play-by-play, video, and official name data, are recommended next steps.
References
[1] Intangibles: Unlocking the Science and Soul of Team Chemistry
Appendix
Jupyter Notebook: NBA Game Score Difference
Acknowledgements
A special thanks to Blake at Springboard for his mentorship in this capstone. You are awesome.